
Published in Military Embedded Systems
Authored by Tammy Carter of Curtiss-Wright and Beau Paisley of Arm.
Serial algorithms can be evolved to a scalable, multithreaded, multiprocess implementation using ubiquitous and well-established high-performance computing (HPC) programming frameworks such as OpenMP and MPI. Such techniques are used in compute-intensive defense, aerospace, and industrial applications.
For this example, we will calculate a numerical approximation of pi, but we need not discuss the details of the algorithm here. One of the benefits of using a source code profiler is the ability to grasp a deep understanding of the application’s performance, which can lead to performance improvements without requiring a deep understanding of the underlying mathematics. For any code optimization effort, it is critical to measure performance and code correctness at each step of optimization. It is useless to have very fast code that yields the wrong answer. By using a mature, industry-proven tool that includes both an HPC debugger and a source code profiler, this effort is greatly simplified. Let’s start using the source code profiler to study our single thread implementation. From our run summary, we see that the program was executed in 30.6 seconds, and from the main tread activity chart, we see that 100 percent of the time was spent in the single thread compute. (Figure 1.)
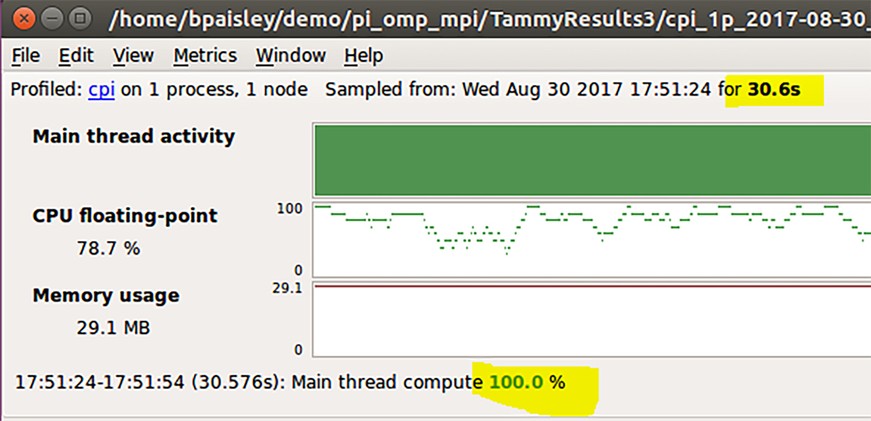
Figure 1: Run summary shows 100 percent of the time was spent in the single-thread compute.
In the profiler, chart lines representing the percentage of time spent on each line of code are displayed next to the line. Therefore, from the data, we can visually see that the bulk of time expended in our application is inside the “for” loop on line 68. (Figure 2.)

Figure 2: Most of the time was spent inside the “for” loop on line 68.
This loop is an ideal candidate for OpenMP, an easy-to-use, directive-based API for parallel programming. A pragma-based system, OpenMP can greatly simplify the threading of numerical algorithms by providing an abstraction to hide the complexity of creating threads, killing threads, and managing work synchronization.
Next, we add a pragma to parallelize the “for” loop on line 68. (Figure 3.) So, what is the pragma directing the compiler to do? The “parallel” keyword signals that each thread will concurrently execute the same code while the “for” keyword is a workshare construct that splits the loops’ iterations among the threads. One of the challenges is to make the loop iterations independent so the instructions can safely execute in any order. In our example, “sum” is a dependence between loop iterations; this is a common situation and is known as a reduction. In this case, a local copy is made of “sum” and it is initialized (the “+” is an operator signifying an initial value of 0). The local copies update on the individual threads and upon completion combine into a single value to update the original global value. Finally, the private keyword notates the “x” is a local variable visible only inside each thread.

Now we rerun the code in the profile to quantify the optimization effort and verify correctness. (Figure 4.)
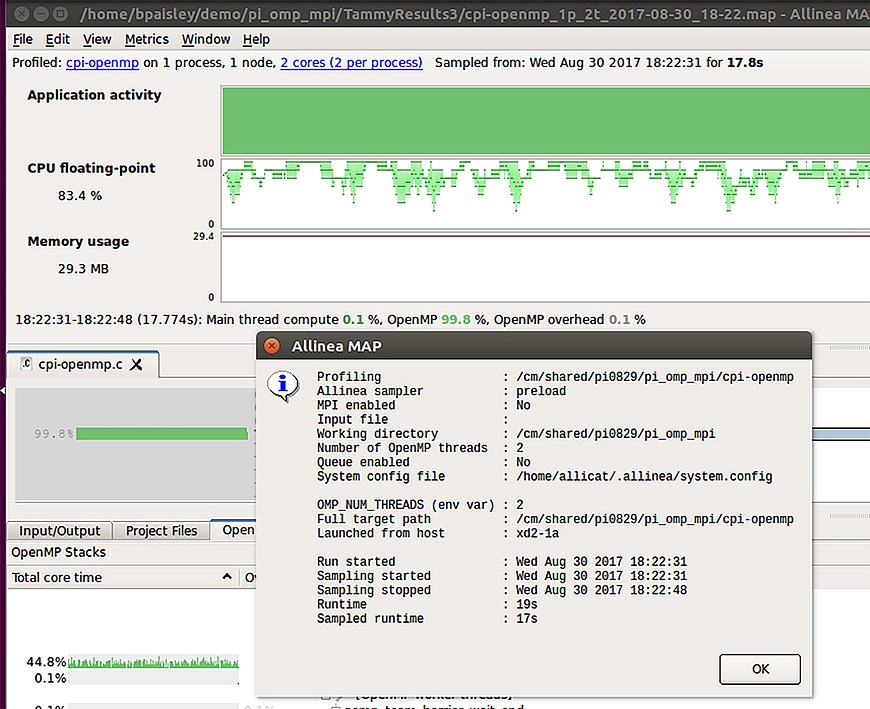
From the run dialog window, we can verify that the program used two threads, and the total run time is reduced to 19 seconds. Reducing the original runtime by almost half, or nearly doubling the performance, is a great start. From the “CPU floating-point” chart, note that more than 83 percent of the total run time is spent performing floating-point operations which is also quite good. Also, in the “Application Activity” chart, the indication that over 99 percent of the compute time was spent within the OpenMP section confirms efficient use of the pragma. These powerful performance gains result in more efficient use of the DSP board’s processing power, but can we achieve even greater performance gains?
By combining multiple processes and multiple threads, we may be able to scale our application further. The next step is to add a communication protocol for parallel programming, known as the Message Passing Interface (MPI). The MPI standard defines a broad range of routines for both point-to-point and collective communications. There are numerous open-source and commercial implementations of MPI and an overwhelming percentage of parallel programmers use it. Providing flexibility to the communications, MPI particularly excels with SIMD [Single Instruction Multiple Data]-style algorithms. These algorithms are most applicable where data can be partitioned in a regular form and spread across multiple processors. More information is available at http://mpi-forum.org/. For our application, we will modify the “for” loop so each process will operate on a subset of the iterators. The modified “for” loop now looks like the shot in Figure 5.

Figure 5: The “for” loop is modified so each process will operate on a subset of the iterators.
This “for” loop will run in multiple processes, where each process works with a subset of the iterators. For this test, we will run with two processes, with two threads per process, so each process will work on half the iteration domain. (Figure 6.)
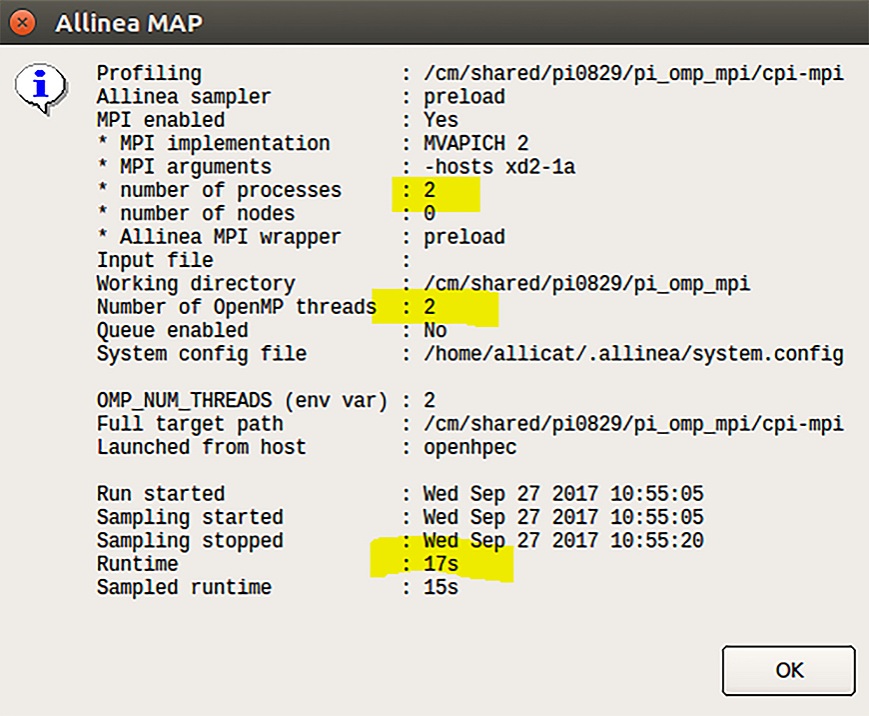
Figure 6: The test is run with two processes.
Viewing the run summary dialog window, we see the application was indeed spread across two processes and two threads which resulted in a total runtime of 17 seconds. (Figure 7.) Just a minute – what happened? We thought our algorithm was very scalable, so we expected runtime of closer to eight seconds, or half the time of the single-process, two-thread run). Let’s take a closer look at the source code profiler’s CPU time metrics.
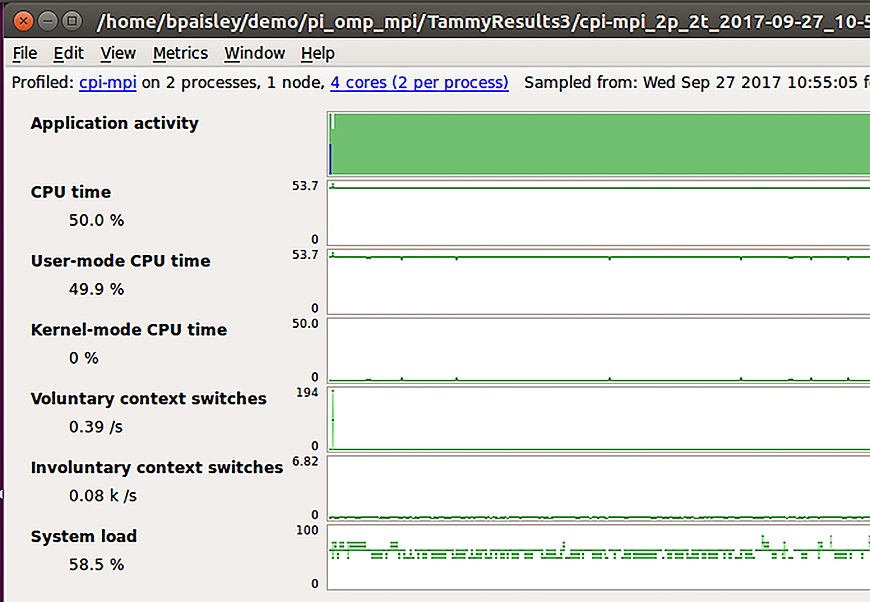
Figure 7: The total runtime was 17 seconds, with the CPU time running at around 50 percent.
“CPU time” should be near 100 percent, but instead it is around 50 percent. Also, the number of “involuntary context switches” is extremely high. A large number of involuntary context switches can serve as an indication of processes being migrated between processors, and the low CPU time confirms this. For this example, we are using the MVAPICH2 implementation of MPI. Let’s dig into the implementation-specific documentation for MVAPICH2. It states that if a program combines MPI and OpenMP (or another multithreading technique), then processor affinity needs to be disabled. Enabled by default, processor affinity, also known as CPU pinning, binds all threads to run on the same core, which negates the benefits gained from multithreading as proven in the previous run. In MVAPICH2, setting the environment variable MV2_ENABLE_AFFINITY to zero disables affinity. (Figure 8.)
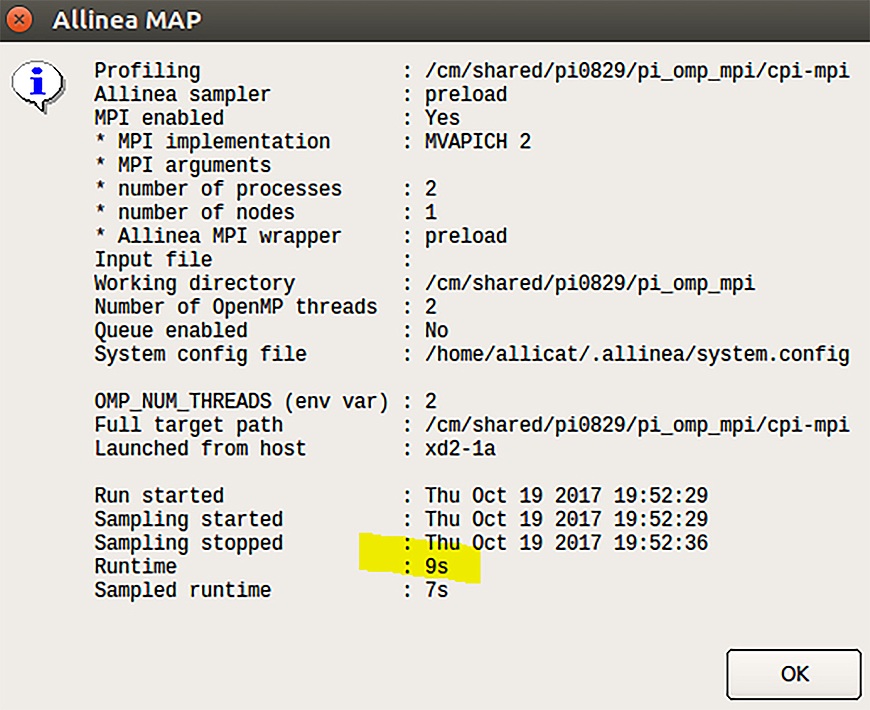
Figure 8: Setting the environment variable MV2_ENABLE_AFFINITY to 0 disables affinity.
With affinity disabled, the total run time comes in at nine seconds, much closer to the expected timing.
This brief pi exploration demonstrates the best practices of using a systematic methodology and process to perform code optimization. The steps can be summarized as 1) making a hypothesis of expected performance, 2) using a tool to quantify performance, and 3) comparing the hypothesis against real data. It may seem that a factor of two in performance would be easily noticed but even quantities of this magnitude are easily overlooked if you do not systematically quantify your performance.
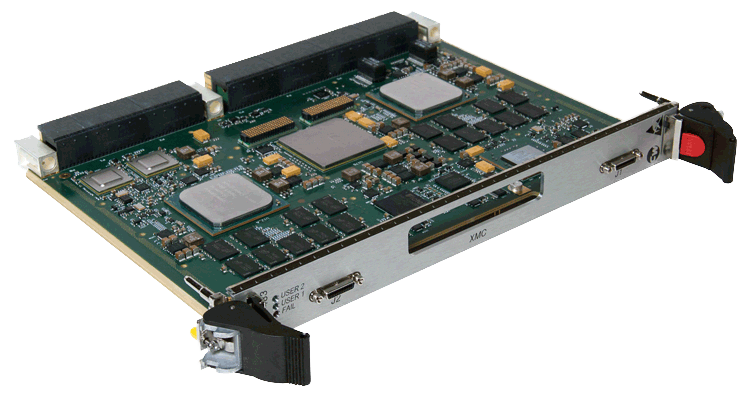
Figure 9: The Curtiss-Wright CHAMP-XD2 OpenVPX board uses a pair of extended-temperature eight-core XEON-D processors.
Compute-intensive defense, aerospace, and industrial applications will benefit from multithreading and multiprocessing. The Curtiss-Wright CHAMP-XD2 OpenVPX board, with its pair of extended-temperature eight-core XEON-D processors, is the board used in the example (Figure 9). The above example shows that relatively few code modifications can improve the performance of a serial numerical algorithm using software technologies, such as OpenMP and MPI. It also shows the importance of debugging and performance-measurement tools to verify and validate performance. The snapshots in this article are from the Arm Forge, consisting of the DDT debugger and MAP profiler (included in the Curtiss-Wright OpenHPEC Accelerator Tool Suite).
Read the full article here in Military Embedded Systems.